Scipy : boite à outils d’algorithmes
Optimisation
>>> def f(x):
...     return x**3 - x**2 - 10
>>> from scipy import optimize
>>> optimize.fsolve(f, 1)
2.5445115283877615
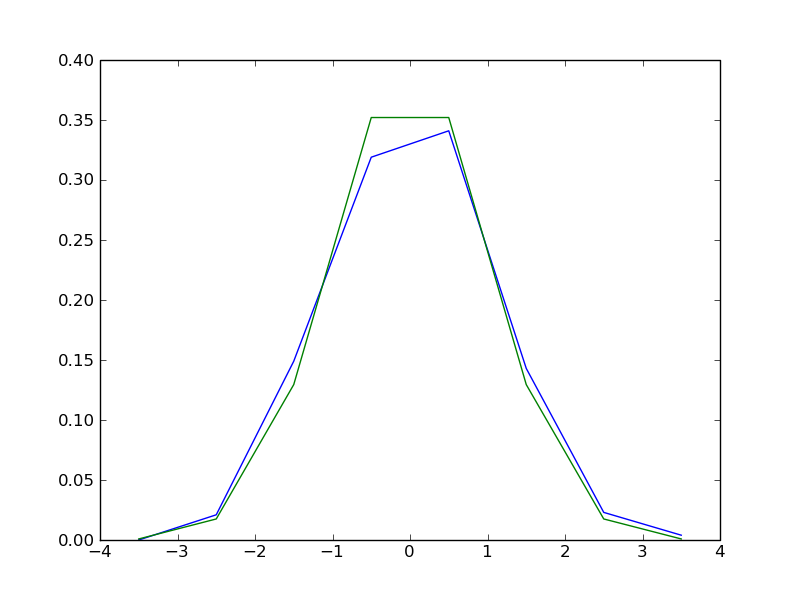
Statistiques et nombre aleatoires
>>> a = np.random.random(size=1000)
>>> bins = np.arange(-4, 5)
>>> bins
array([-4, -3, -2, -1,  0,  1,  2,  3,  4])
>>> histogram = np.histogram(a, bins=bins)
>>> bins = 0.5*(bins[1:] + bins[:-1])
>>> bins
array([-3.5, -2.5, -1.5, -0.5,  0.5,  1.5,  2.5,  3.5])
>>> from scipy import stats
>>> b = stats.norm.pdf(bins)
In [1]: pl.plot(bins, histogram)
In [2]: pl.plot(bins, b)
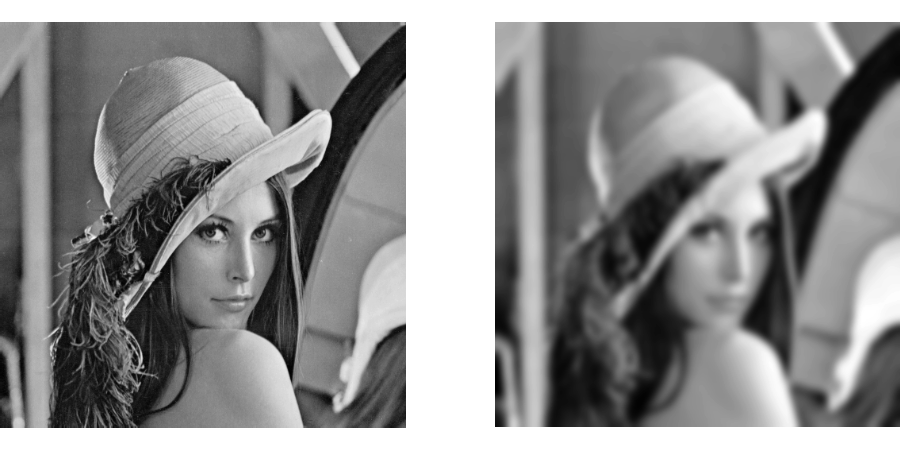
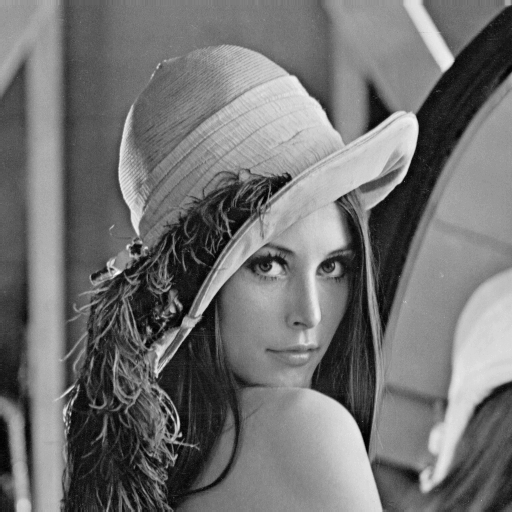
Manipulation d’images
from scipy import ndimage
l = sp.lena()
pl.imshow(ndimage.gaussian_filter(l, 5), cmap=pl.cm.gray)
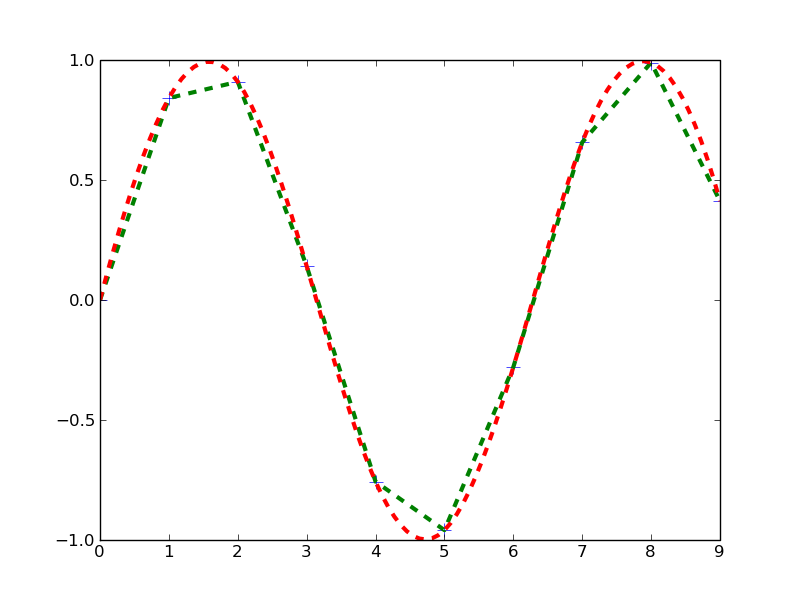
Interpolation
x = np.arange(10)
y = np.sin(x)

pl.plot(x, y, '+', markersize=10)

from scipy import interpolate

f = interpolate.interp1d(x, y)
X = np.linspace(0, 9, 100)
pl.plot(X, f(X), '--')

f = interpolate.interp1d(x, y, kind='cubic')
X = np.linspace(0, 9, 100)
pl.plot(X, f(X), '--')
Interlude

l = sp.lena()
l = l[235:235+153, 205:162+205]

t = pl.imread('tarek.jpg')
t = t[::-1, ...]
t = t.sum(axis=-1)

pl.figure()
pl.imshow(t, cmap=pl.cm.gray)
pl.axis('off')

pl.figure()
pl.imshow(l, cmap=pl.cm.gray)
pl.axis('off')

t = t.astype(np.float)
t /= t.max()

l = l.astype(np.float)
l /= l.max()

pl.figure()
pl.imshow(t + l, cmap=pl.cm.gray)
pl.axis('off')

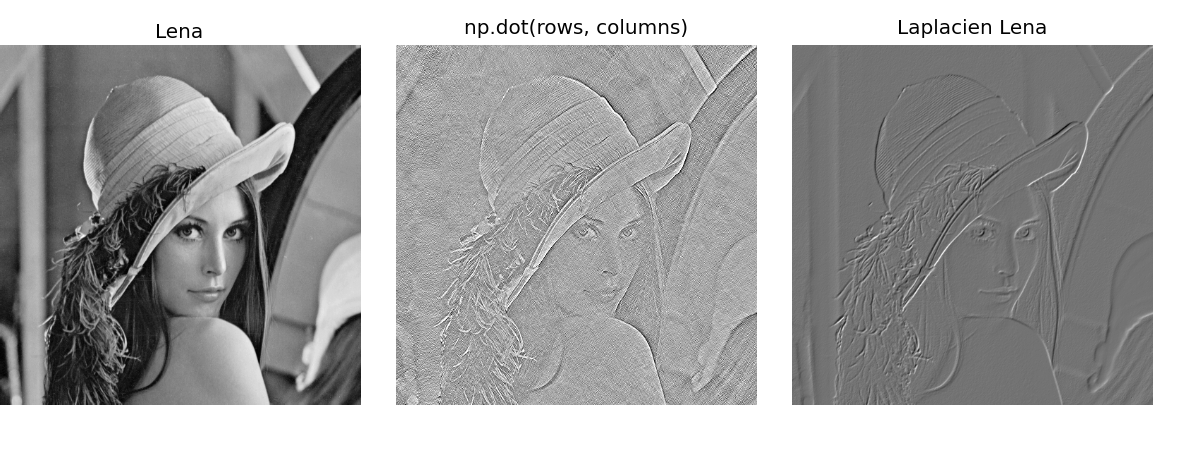
Algebre Lineaire
“blanchissement” de Lena:
rows, weight, columns = np.linalg.svd(l, full_matrices=False)
l_ = np.dot(rows, columns)